
On 22 June the Parliament passed the Fair and Sustainable Pensions Bill, increasing the full pension asset range by up to 31% (couples) but slashing the part pension asset range by around 48% from 1 January 2017. We have included this in the 1 July release assuming the new taper rate and the present value of the new assets thresholds are applicable now. We suggest all RIS users review their retirement plans in light of these changes:
| As at 30 June 2015 | From 1 January 2017 | |
| Single home-owner asset threshold | $202,000 | $250,000 |
| Single not home-owner asset threshold | $348,500 | $450,000 |
| Couple home-owner asset threshold | $286,500 | $375,000 |
| Couple not home-owner asset threshold | $433,000 | $575,000 |
| Asset taper rate | $1.5 per fortnight for every $1000 of assets over threshold | $3 per fortnight for every $1000 of assets over threshold |
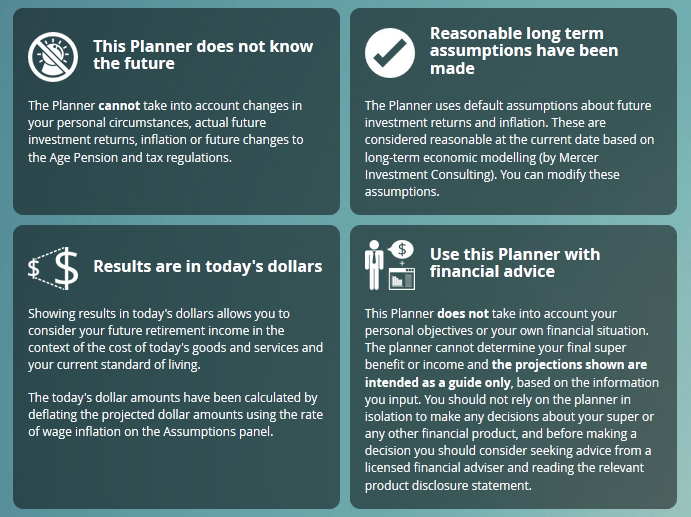
We all tend to glaze over when presented with those necessary but dense T&Cs. Well the RIS has had a front page makeover, and here is the same content but presented better. Four important things you need to know about using the RIS, but a simple icon and a brief heading gets the message across more effectively.
We’ve also changed the way charts get incorporated into the PDF. Previously we converted the chart to an image before putting them onto the pdf. However now we re-create the chart on the server and add it into the PDF. You can see the differences in the following two images:
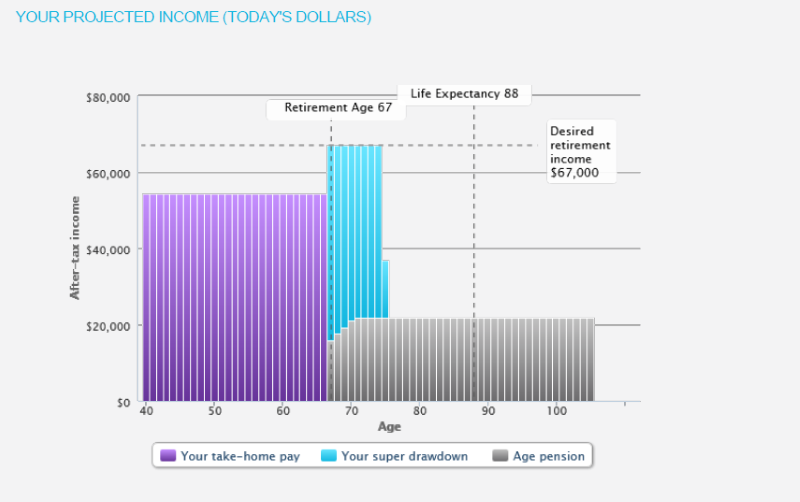 after:
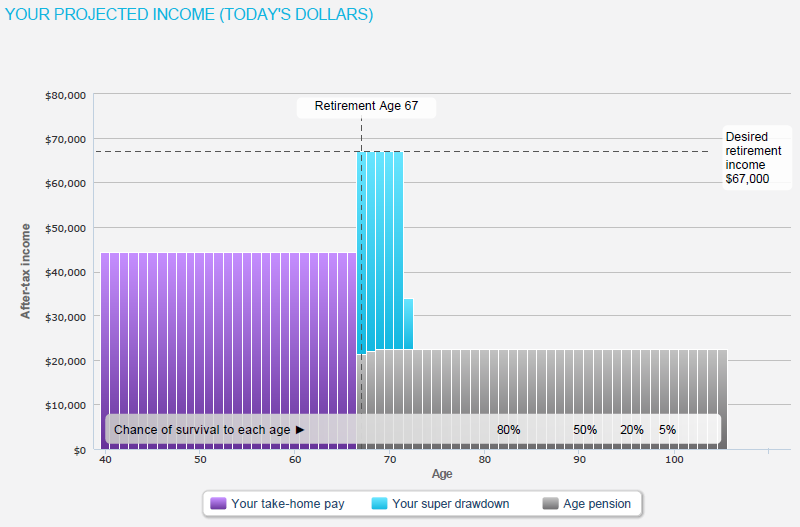
Notice how much sharper the text is - if you zoom in on the PDF text it will now be crystal clear, no matter the size.
before: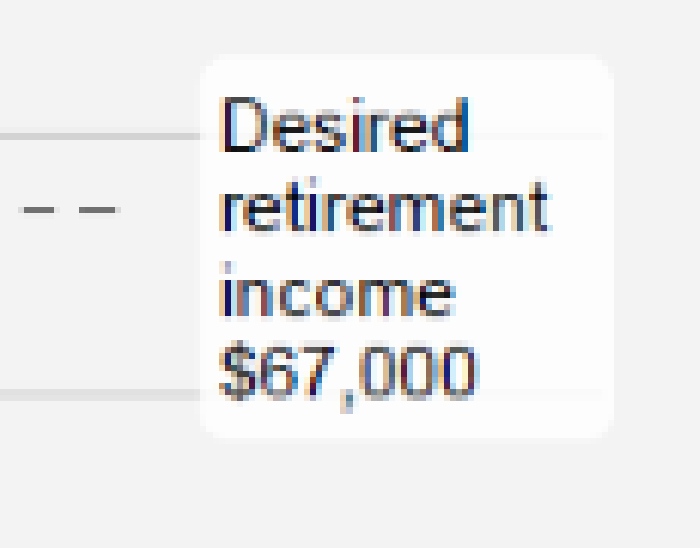 after:
 This also means that printing your PDF will give you a much better quality printout.
© 2026 - Mercer LLC, All Rights Reserved